In today’s data-driven world, making informed decisions requires a thorough understanding of the data at hand. Data analytics serves as the key to unlocking valuable insights, but the process involves more than just crunching numbers. Acquiring right data analytics skills is a great way to advance your career. In this simple, 7-step guide, I will walk you through the essential steps of data analytics, from understanding the raw data to visualizing the results. If you are wondering which tools to use to begin your journey, head to this article to understand differences between widely used data analytics tools.
Step 1: Understand the data
To embark on a successful data analytics journey, the initial step is gaining a deep understanding of the dataset. Each column in your dataset holds a piece of the puzzle, and to solve it, you need to comprehend what each variable represents. For instance, in a sales dataset, understanding what information is stored in columns like “Revenue,” “Quantity Sold,” and “Customer ID” is crucial.
Tips for gaining domain knowledge include consulting with subject matter experts, studying relevant documentation, and exploring the business context surrounding the data. The better you understand the data, the more effectively you can derive meaningful insights.
Step 2: Explore the data
Once you’ve grasped the basics of your dataset, the next step is to explore it thoroughly. This involves identifying and addressing potential issues such as missing values, inconsistent data types, and outliers. Start by running basic statistical analyses to gain insights into the distribution of your data.
Handling missing values is paramount; consider imputation methods or evaluate the impact of excluding incomplete entries. Inconsistencies in data types, such as mixing numerical and categorical values, can be rectified during this stage. Remember, a comprehensive exploration sets the stage for cleaner and more accurate analyses.
Step 3: Validate your data
With a clear understanding of the dataset and potential issues addressed during exploration, the next step is validation. This involves ensuring the consistency and reliability of the data. For example, if your dataset includes customer information, validate that each customer ID corresponds to a unique and accurate customer name.
Cross-referencing data between related columns is crucial. Inconsistent relationships, like mismatched city-state pairs, must be rectified. Validation ensures the reliability of your dataset, laying the foundation for trustworthy analyses and insights.
Step 4: Clean the data
Validation often uncovers anomalies and discrepancies that need to be addressed. Cleaning the data involves correcting these issues to ensure data integrity. Anomalies, outliers, and inaccuracies identified during exploration and validation should be carefully handled.
Methods for cleaning data include imputing missing values, removing outliers, and rectifying inconsistencies. A clean dataset is essential for accurate analysis and prevents misleading conclusions based on flawed data.
Step 5: Prepare the data – wrangling & manipulation
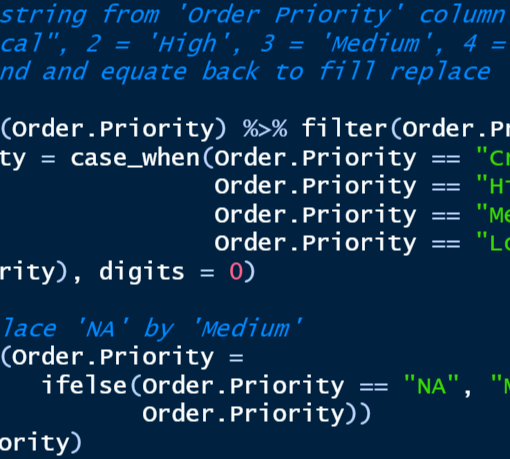
Data wrangling, also known as data munging, involves the transformation and manipulation of data to prepare it for analysis. This step is essential for creating new variables, aggregating data, and structuring the dataset to meet the specific requirements of your analysis.
Examples of data wrangling include creating calculated fields, aggregating data by time periods, or combining datasets to enrich information. Efficient data wrangling sets the stage for more nuanced and sophisticated analyses.
Step 6: Get the insights – analyze the data
With a clean and well-prepared dataset, you’re ready to dive into analysis. Explore trends, patterns, and relationships within the data. Statistical analyses, machine learning algorithms, and other analytical techniques can be employed to uncover valuable insights.
Iterative analysis is often necessary to refine hypotheses and draw meaningful conclusions. During this stage, leverage the power of statistical tools and algorithms to extract actionable information from your dataset.
Step 7: Present your story – visualize your findings
Data visualization is a powerful tool for communicating your findings effectively. Once you’ve conducted your analysis, the next step is to create visualizations that tell a compelling story. Choose the right charts, graphs, and visuals that align with the nature of your data and the insights you want to convey.
Visualizations not only make complex information more accessible but also enable stakeholders to grasp trends and patterns at a glance. Whether it’s a bar chart, scatter plot, or a more sophisticated interactive dashboard, thoughtful visualizations enhance the impact of your data analysis.
To conclude, in the journey from understanding raw data to crafting meaningful visualizations, each step plays a crucial role in the data analytics process. A systematic approach ensures that your analyses are accurate, reliable, and ultimately contribute to informed decision-making.
Recapping the key steps — understanding, exploring, validating, cleaning, wrangling, analyzing, and visualizing — reinforces the importance of a well-rounded data analytics strategy. Embrace this process to unlock the full potential of your data and drive impactful insights.


